I recently re-read Marty Whitman's book - Value Investing, A Balanced Approach. Whitman's writing is a bit academic sounding and hard to understand, but his insights are amazing. I find that his ideas on creating wealth and resource conversions provide an investment edge because these ideas don't screen well. Whitman says that earnings are not the only form of wealth. A quick way to understand this is Paul Graham's example of creating wealth by fixing a beat-up old car. There are no earnings if this car is not sold, but wealth or economic value has been created. Similarly, Whitman explains how companies can create wealth in tax efficient manners.
Here are some key points from the book:
1. Focus on what the numbers mean, not what the numbers are
Whitman says that GAAP earning is a starting point and is an accounting tool, and is not meant to capture economic reality. His advice: Start with earnings and make adjustments to account for economic reality. Whitman is NOT advocating for accepting adjusted earnings as peddled by management, but to create one's own estimate of earnings that mirror economic reality.
Here's one example from the book to illustrate the point of focusing on what numbers mean: Forest City Class A shares in 1991 were selling for $20/share though the annual report stated that the appraisal of income producing assets alone came to $80/share. The disconnect existed because real estate environment was depressed and Forest city reported GAAP losses. The earnings were depressed due to depreciation and amortization for accounting purposes. In reality, the value of the buildings was increasing.
My previous investment $FRPH (now sold) reported GAAP losses in almost all quarters, though they were significantly enhancing value by putting land parcels to higher use (i.e. resource conversion) either as residential buildings or industrial warehouses. The owner operators - the Baker family - didn't prioritize earnings but were focused on lowering taxes and enhancing economic value via resource conversion.
Another example given by Whitman is that GAAP Current assets maybe more like fixed assets in case of going concerns (Eg: Sears inventory is almost a fixed asset if it needs to be in business), while Forest Cities can sell fixed assets such as Class A building by placing a phone call, so this fixed asset is more like current asset in terms of economic reality.
Fast growth software companies present similar challenges when using GAAP earnings. One of my current investments - $GAIA shows big losses on income statement because they are spending lot on marketing and acquiring new users. This marketing spend is expensed by GAAP rules, though it in reality this spend is similar in nature to growth Capex. $GAIA is creating wealth but its not visible from the income statement.
2. Incorrect and excessive focus on earnings
Whitman attacks Wall Street's obsessions with reported earnings. Earnings are volatile and yet they are treated as the most important item when Wall Street looks at companies. He explains that private owners of business create economic wealth while minimizing taxes by reducing earnings.
3. Resource conversion = converting assets to higher use
Whitman maintains that this is the most common way of creating wealth. Resource conversion includes redeployment of assets to other uses, to other ownership, or both.
Examples are:
1. New ownership which will pay considerably higher to acquire the company (eg: M&A, LBO)
2. Use of existing asset base to create large new NAVs (eg: Forest city, Tejon Ranch, St Joe)
3. Use of existing asset base to realize markedly improved earnings and ROE during next up cycle, eg: US semiconductor equipment stock, Tecumseh Products stock
Companies go through M&A, spinoffs, recapitalizations, MBO, LBO, etc quite often and yet the market mostly focuses on analyzing companies only as going concerns and not as resource conversion opportunities.
At the most basic level, Whitman is asking value investors to look at companies from the lens of private, control owners and not just minority stockholders.
4. Management = operators + investors
There is overemphasis on the role of management as operators, but not enough as investors. If one considers that resource conversions happen often during a company's lifetime, it follows naturally that management's role as investors is as important as their role as operators.
5. Balance sheet strength can translate into cash flow strength
A strong balance sheet can be a source of strength and lead to improved cashflows in the future.
Whitman gives example of Nabors post bankruptcy where there was no debt on the balance sheet in mid 1988. Other oil service companies at that time were burdened with lot of debt. Nabors used its financial strength to buy contract drillers and contract driller assets at cheap prices because they were the only ones bidding. The result was that cashflow from operations went from loss of $20M in 1987 to positive $200M in 1997.
6. Access to ultra cheap financing can be a source of value
Wealth can be created by access to cheap source of capital. Examples are banks and well managed insurance companies
Saturday, August 11, 2018
Sunday, July 1, 2018
$AINC - middleman company with growth levers
Lately, I’ve been thinking about middlemen businesses. The
Private Investment Brief wrote this thought provoking
article on middlemen and why they exist. I've made several investments in middlemen companies - $LNG (toll operator for liquified natural gas), $EVI (distributor of laundry equipment with rollup strategy, $YTRA (#2 OTA in India). LNG and EVI thesis have played out well, while YTRA has been plagued by baffling capital raising decisions by management (25% dilution at $5.5/share. My cost basis ~$7.5/share). This post focuses on investment initiated last week - AINC - middleman / asset manager for AHT and BHR.
I think middle men definitely provide value, and they charge fees for that. But sometimes middlemen can also extract value from the ecosystem, which can be a good or bad thing
depending on where you stand. An example: Warren Buffett recently commented
that real estate agents (middlemen) provide valuable services especially for
first time home buyers. I have the opposite opinion : realtors are extremely pricey middlemen that don't provide value for the high $ commissions in high cost regions, especially now that Zillow and Redfin provide so much search data. Buffett gains
from the realtor fees from Berkshire Hathaway HomeServices, while I lose on the
fees if I buy a house. How we think of middlemen depends on where we stand.
Now on to Ashford Inc Ashford Inc
(AINC) – the asset manager for Ashford Trust (AHT)
and Braemar (BHR). I first found about Ashford Inc from Greenhaven Road Capital's Q118 letter to investors. The basic thesis is that AINC is the vehicle for the CEO (actually the Bennett family) to extract value from AHT and BHR. Again, how we think of middlemen depends on where we stand. So if we stand as investor in AINC we can benefit, while shareholders of AHT and BHR might lose (gain and loss are relative terms here).
Stable base fees and onerous termination clause
AINC is setup to extract fees
from AHT and BHR. Its the vehicle for Bennett family to extract more value for
themselves. AINC provides management services for Ashford Trust and Braemar
based on contract that has onerous termination requirements (atleast 12 times
net earnings from each of the REIT, among other conditions). Such onerous
termination clauses make the base fees a stable revenue source.
Base fees 0.7% of Market capitalization (where Market capitalization includes both equity and debt)
Incentive fees 5% * TSR outperformance * Total equity
2017 Base fees: $34.7M (Ashton Trust)
and $8.8M (Braemar)
2017 Incentive fees: $1.8M (Ashton
trust) and $1.3M (Braemar)

Ashford Inc shown as New Holdco
in this diagram

Where is Bennett family money tied up?
The upside comes from the fact
that Bennetts can increase assets under management for AHT and BHR and increase
the fees they get from AINC. This seems easy to do since they manage all three
entities – AINC, AHT, BHR.
Another useful check if AINC
earnings are Bennett’s top priority is to check which entity has most of their
capital tied up. Among the public companies that they manage, Ashford Inc is
their biggest asset, i.e. their main vehicle to grow their riches. Post Remington
Project management transaction, the Bennetts will have $225M tied in AINC ($22M
stock + $223M in convertibles) vs $70M in AHT and $16M in BHR.
Remington Transaction:
The Bennett family privately owns
Remington Holdings LP – property and project management company – that Ashford
Inc tried to buy in September 2015 for $321M (combination of stock and
convertible). But Ashford terminated the merger agreement in Mar 2017 because
it was not able to get favorable tax ruling (private letter ruling). In April
2018, Ashford Inc announced plans to acquired only project management portion
of Remington for $203M in form of convertibles with convert price of $140. This
acquisition is not contingent on favorable tax ruling.
Shares outstanding = 2.1M
Current Bennett ownership = 0.3M
Shares from converts = 1.45M
Bennetts will own ~50% of the
company after Remington Project Management acquisition. They benefit a lot from
this transaction – rich valuation on project management business.

Valuation:
Adjusted EBITDA = $17.4M (from AHT and BMR base fees_ +
$4.5M (From J&S full year) + $16M (from Remington project management) = $38M
EV = $130M (market cap) + $203M (convertible for Remington
project management transaction) - $34M (cash) = $229M
EV / EBITDA = 7.8
While this seems okayish, there are plenty of levers on growing
the earnings here. Further, there will be positive impact on earnings from
lower tax rates.
Earnings Growth levers:
- Ashford Trust and Braemar acquire more hotel assets via debt or equity issuance
- Ashford Inc expands J&S audio across its entire portfolio
- Pure Rooms and OpenKey growth adds to bottom lin
- Ashford Inc acquires more hotel middleman services
- AHT or BHR acquire another hotel REIT since that area seems ripe for further consolidation
Risk:
The
risk is further dilution by Bennetts who might enrich themselves at expense of
minority shareholders. This could happen if AINC decides to acquire Remington asset
management portion, which is likely to be $100M+ transaction based on previously abandoned deal.
Sunday, May 6, 2018
House prices: hard to believe currently, but they do go down at times
Real estate prices continues to march unabated since the the crash of 2008 - 2012. Many cities (SF Bay area, Seattle) have already crossed the pre-2007 highs (by a lot). San Francisco median price is 2x that of 2007 highs. Just the equity gains made by residents in SF bay area and Seattle are more than average full time worker salaries. Some of this looks unsustainable. Prices look inflated and there's risk off behavior that assumes that house prices continue going up. Examples such as one shown here indicate that some house prices don't cover even carrying costs (interest + property tax). Is Fear of missing out (FOMO) causing these high prices?
I don't claim to know how or when prices might get corrected. But now would be a good time to look at prior housing crashes to remember that housing does not always go up. There's no permanent high plateau in finance, and things go in cycles. Some of the risks which caused house price drops in the past may re-appear, or they may not. Or new risks could emerge that no one thought about, mainly because it sounds crazy until it happens. For example see this awesome post from Morgan Housel.
This post is also inspired by Nassim Taleb's Russian roulette analogy for real life and investing. Paraphrasing Taleb - Reality is like Russian Roulette with 1000 chambers. Just because 999 times there's no bullet, we forgot that there's one bullet still there. It might be useful to consider that one bullet while making real estate buying decisions at current elevated prices. This is not to say that same situation repeats, but its worth noting all the possible outcomes including house price drops.
Examples from Jim Grant's Mr Market Miscalculates:
Kansas Farm Land bubble in 1880
Kansas farm land reached bubble price of $4000/ acre in today’s money in 1880s and is currently only at $800/ sq ft.
First came the frenzy. Newspaper articles from 1880s explained it as lack of land in Kansas territory, east coast lenders couldn’t wait to lend more to get higher yields, and agents sold Kansas as fertile land with adequate rainfall. The rainfall data cited was from the good years and not the norm, and rainfall dropped after new people arrived to farm the land. What followed was familiar bust - farm incomes dropped, farmers could not keep up with debt payments and lost farms, many moved out of the area, and lenders lost a lot of money.
Additional reading: Mr Market Miscalculates, essay on “In Kansas We Busted”
Long Term Price for 45 Beacon St, Boston
Sale Prices are from Kiley in June 1941 edition of The Bulletin of the Business Historical Society
Here’s the historical price for 45 Beacon St
1859 $135K (Sale Price)
1853 $91K (Sale Price)
1929 $400K (Sale Price)
1940 $55K (Sale Price)
2000 $2.9M (city of Boston appraisal)
2006 $6.2M (city of Boston appraisal)
There was 86% markdown from 1929 to 1940, and 114% markup from 2000 to 2006.
Maui real estate bubble (1990)
In 1988-90, 36 two acre lots sold for average $1.8M each due to Japanese frenzied buying.
In 1998, these lots sold for $600K - $800K each - and this was after a recent rebound.
House price drop during Great Depression
House prices dropped a lot in both early 1930s and 1940s as cars disrupted the life of cities and Great Depression reduced demand. Demand for Commercial real estate in downtowns also dropped as more population moved to the suburbs.
House price from Shiller
1930 -4.3%
1931 -8.2%
1932 -10.5%
1933 -3.8%
Houston bubble (1983)
Between 1983 and 1988, median house prices fell by 23% due to collapse of oil prices, resulting drop in jobs in the area and net outward migrations.
Southern California bubble burst
Between 1990 and 1995, avg house prices dropped by 21% due to post Cold war reduction in defense outlays.
John Kenneth Galbraith - Great Florida Real Estate Boom (from A Short History of Financial Euphoria)
Until 1920, sky seemed the limit for property in the growing American city. But then came the automobile, the suburbs, 1929 crash, the ensuing Depression, falloff in immigration and rising burden of real estate taxes.
There was optimism with having Republican president Coolidge, attraction of Florida climate, and use of leverage and only 10% downpayment. As speculation got underway in 1924-25, prices could double in matter of weeks. Choice “beachfront” lots could actually be 10-15 miles away from the beach. Charles Ponzi sold a subdivision “near Jacksonville” when it was infact 65 miles away. In 1926, the market collapsed due to lack of new buyers needed to sustain the upward trend. Powerful hurricane left many homeless. There was futile rush to get out and prices crashed.
San Jose house prices 2006 - 2012:
Because of the dot-com crash, San Jose lost 17 percent of its jobs between 2001 and 2004. In the same period, office vacancy rates increased from 3 to 30 percent. Yet, between the beginning of 2001 and the end of 2004, home prices increased by more than 20 percent. The rise in prices in the face of declining demand can be attributed to speculation— that is, people buying homes as sources of income rather than for shelter. Exacerbating this was the ease of credit. Based on Shiller Index, San Jose house prices drop 26% from 2006 peak to 2012 bottom
Japan housing market crash starting 1992
From New York Times 2005 article - https://www.nytimes.com/2005/12/25/business/yourmoney/take-it-from-japan-bubbles-hurt.html
Mr. Nakashima, a Tokyo city government employee who was then 36, took out a loan for almost the entire $400,000 price of a cramped four-bedroom apartment. With property values rising at double-digit rates, he would easily earn back the loan and then some when he decided to sell.
Or so he thought. Not long after he bought the apartment, Japan's property market collapsed. Today (2005), the apartment is worth half what he paid. (After falling prices, there were few takers for far away suburbs because Tokyo became more affordable)
Mr. Nakajima said he had barely missed being stuck out there himself. In 1991, he was looking at a 100-square-meter apartment (1,080 square feet) for about $600,000 about two hours outside Tokyo. He said his wife stopped him. Six years later, he spent the same amount to buy a more spacious house in a downtown neighborhood. "Maybe my wife should be the economist," he said.
At the market's peak in 1991, all the land in Japan, a country the size of California, was worth about $18 trillion, or almost four times the value of all property in the United States at the time. Then came the crashes in both stocks and property, after the Japanese central bank moved too aggressively to raise interest rates. Both markets spiraled downward as investors sold stocks to cover losses in the land market, and vice versa, plunging prices into a 14-year trough, from which they are only now starting to recover.
In the 1980's, Professor Noguchi said, the frenzy in Japan reached such extremes that companies tried to outbid one another even for land of little or no use. At the peak, an empty three-square-meter parcel (about 32 square feet) in a corner of the Ginza shopping district in Tokyo sold for $600,000, even though it was too small to build on.
London house price crash of 1989
According to Nationwide, a UK mortgage lender, the average London home was selling for just under £98,000 in the summer of 1989. Prices then fell by one-third and didn’t top £100,000 for nine years. Cumulative inflation over the same period was well over 50 per cent. London housing in the late 1980s was a disastrous investment.
Toronto House price crash of 1990
The cause was rising interest rates. The early 1990s housing crash followed the late 1980s housing boom, which was driven by an over-heating economy allied with the consequences of financial liberalisation. Specifically, in April 1988 an interest rate cut to curb the pound’s ascent against the deutschemark boosted the housing market. By the second half of 1988, however, interest rates were raised aggressively to dampen inflationary pressures. The base rate touched 7.5 per cent in mid 1988. In 1989 it was increased to 15 per cent. Many affordable mortgages in 1988 thus became unaffordable in 1989.
The downturn lasted for 6 years and many buyers walked away from a deal after the downturn started.People forced to sell had to accept 1991 deflated prices. For instance, Stinson real estate recently sold a penthouse for $299,000 - a couple of years ago it would have reaped $450,000 to $495,000.
There was story of elderly man buying 3 condos with his $300K retirement and losing it.A similar repeat story from 2018 was a CIBC bank teller buying a second condo and renting it out to previous owner of the condo
Many of the people who suffered losses during the real-estate slump of the past two years stretched themselves too thin and purchased properties they could not afford” - Brad Lamb, Dec 21, 1991
Tuesday, April 24, 2018
$FRPH - Value in Action
tl;dr: Bought FRPH at $39/share in July 2016. Currently, the stock is at $58/share, driven mainly by value enhancing steps taken by owner-operators, the Baker family. This article reviews how FRPH put Value in Action.
FRPH recently announced the sale of their industrial warehouse assets (41 properties) to Blackstone for $359M. The management announced that this was good time to sell given lower taxes and low cap rates. I thought this transaction provided a good opportunity to write about FRPH as "Value in Action" investment. The management doesn't promote the stock much - just look at their bare bones Investor relations website, but they have been long term owner-operators and have created significant value.
FRP Holdings ($FRPH) was formed in 1986 from spin off of real estate and transportation businesses from Florida Rock Industries. I first learned about FRPH from a stock pitch by Bill Chen of Rhizome Capital Partners. The original Florida Rock was run by the Baker family. The Bakers sold Florida Rock, a constructions materials company (aggregate mining and cement and concrete products), to Vulcan Materials for $4.6B in 2007. In 2015, FRP spun off its transportation segment into Patriot Transportation Holdings. Based on their long term record (1994 - now), the Bakers have been long term oriented and patient capital allocators, and they own 32% of FRP Holdings. They have extracted value from the original Florida Rock via spin offs, resource conversions, sale of businesses, and tax efficient and sale.
Here's how the market cap has increased in the last 20 years:
Florida Rock Industries 1994: $260M, 2007 (sold): $4.6B
FRP 1998: $111M, 2018 (FRPH + Patriot): $642M
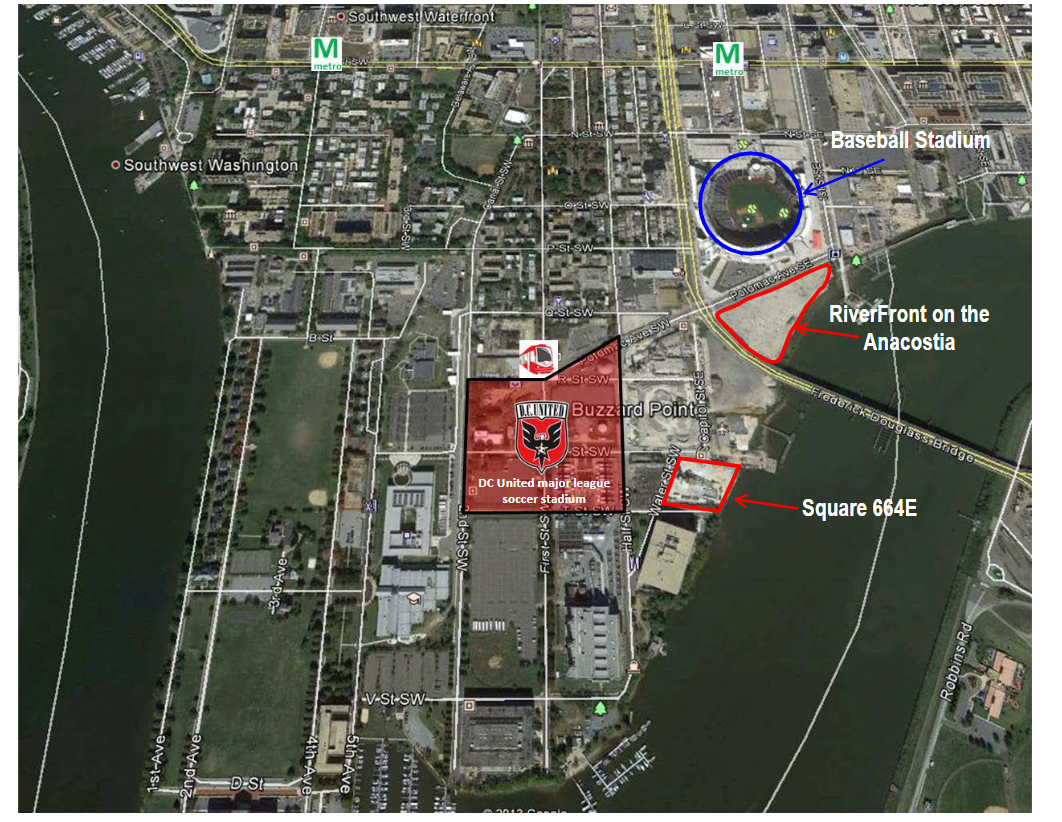
Martin Whitman said that resource conversion is a more common source of wealth than earnings growth. An example of resource conversion by FRPH is the transformation of concrete plant on the side of Anacostia river to Dock 79 which offers apartments and high end restaurants. Part of this conversion was possible due to construction of the Nationals baseball stadium in that area and accompanying transformation from industrial to residential / mixed used area in DC's Capitol Riverfront area.
Dock 79

Before 2011: Dock 79 site was a concrete batch plant (Source: JDLand.com)


FRPH plans to develop Dock 79's adjoining land parcel into another apartment building (Phase 2) below - 71 Potomac - where they are starting construction in Q218. This will be followed by 2 more phases (yet undetermined) following the construction of new Frederick Douglass bridge in 2021.

The Hampstead Trade Center offers another example of value enhancing play from the Bakers. FRPH bought it as part of 1031 exchange. 1031 exchanges are standard way that FRPH reinvests proceeds from sale of real estate, and lowers tax burden. They have now re-zoned this land from commercial business part to residential use and are looking to sell it.
Table 1 below shows the valuation estimates from both 2016 and now for FRPH. I've adjusted the estimates up as FRPH has executed on enhancing value. Though the valuation estimate is $69/share, I think its possible that the Bakers can find additional ways to enhance the value, especially in the Land Development segment.
Table 1: Sum of the parts valuation for FRPH


Many of the developments in Note 2 are long term projects and so putting value on these is hard. But the location of some of these land lots makes it an attractive investment. The Phase II of Riverfront has broken ground and construction will start soon. But Phase III and IV will proceed only after construction of the new Frederick Douglass bridge which is scheduled to complete construction by 2021.
For 2nd life of mines, Ft Myers second life will start in 8-10 years after mining has ended.
Buzzard point (square 664E) site is along the Anacostia river close to the new DC United Soccer stadium which opens in July 2018. This has the potential to a valuable site similar to Dock 79 (close to Nationals baseball stadium).

What are the future possibilities?
1. Spin off of mining segment
2. 1031 exchange for the Industrial warehouse sale
3. Continued development of Riverfront Phases II - IV
4. Massive growth in Buzzard Point area, similar to Capitol Riverfront / Navy Yard area
5. Sale of Hampstead residential lots with horizontal development
FRPH recently announced the sale of their industrial warehouse assets (41 properties) to Blackstone for $359M. The management announced that this was good time to sell given lower taxes and low cap rates. I thought this transaction provided a good opportunity to write about FRPH as "Value in Action" investment. The management doesn't promote the stock much - just look at their bare bones Investor relations website, but they have been long term owner-operators and have created significant value.
FRP Holdings ($FRPH) was formed in 1986 from spin off of real estate and transportation businesses from Florida Rock Industries. I first learned about FRPH from a stock pitch by Bill Chen of Rhizome Capital Partners. The original Florida Rock was run by the Baker family. The Bakers sold Florida Rock, a constructions materials company (aggregate mining and cement and concrete products), to Vulcan Materials for $4.6B in 2007. In 2015, FRP spun off its transportation segment into Patriot Transportation Holdings. Based on their long term record (1994 - now), the Bakers have been long term oriented and patient capital allocators, and they own 32% of FRP Holdings. They have extracted value from the original Florida Rock via spin offs, resource conversions, sale of businesses, and tax efficient and sale.
Here's how the market cap has increased in the last 20 years:
Florida Rock Industries 1994: $260M, 2007 (sold): $4.6B
FRP 1998: $111M, 2018 (FRPH + Patriot): $642M
Martin Whitman said that resource conversion is a more common source of wealth than earnings growth. An example of resource conversion by FRPH is the transformation of concrete plant on the side of Anacostia river to Dock 79 which offers apartments and high end restaurants. Part of this conversion was possible due to construction of the Nationals baseball stadium in that area and accompanying transformation from industrial to residential / mixed used area in DC's Capitol Riverfront area.
Dock 79
Before 2011: Dock 79 site was a concrete batch plant (Source: JDLand.com)
2016: Dock 79 from the same angle as the concrete plant picture above (source: JDLand)
FRPH plans to develop Dock 79's adjoining land parcel into another apartment building (Phase 2) below - 71 Potomac - where they are starting construction in Q218. This will be followed by 2 more phases (yet undetermined) following the construction of new Frederick Douglass bridge in 2021.

The Hampstead Trade Center offers another example of value enhancing play from the Bakers. FRPH bought it as part of 1031 exchange. 1031 exchanges are standard way that FRPH reinvests proceeds from sale of real estate, and lowers tax burden. They have now re-zoned this land from commercial business part to residential use and are looking to sell it.
Table 1 below shows the valuation estimates from both 2016 and now for FRPH. I've adjusted the estimates up as FRPH has executed on enhancing value. Though the valuation estimate is $69/share, I think its possible that the Bakers can find additional ways to enhance the value, especially in the Land Development segment.
Table 1: Sum of the parts valuation for FRPH
Note 1: Proceeds from Industrial Warehouse sale to Blackstone (all numbers in $K). I didn't include cash tax from this table in the valuation because the Bakers have successfully used 1031 transactions to avoid paying taxes. I do think that they'll end up paying some taxes, but don't know what number from $0 to $50M to put on it.
Note 2: Valuation for Land Development Segment
Many of the developments in Note 2 are long term projects and so putting value on these is hard. But the location of some of these land lots makes it an attractive investment. The Phase II of Riverfront has broken ground and construction will start soon. But Phase III and IV will proceed only after construction of the new Frederick Douglass bridge which is scheduled to complete construction by 2021.
For 2nd life of mines, Ft Myers second life will start in 8-10 years after mining has ended.
Buzzard point (square 664E) site is along the Anacostia river close to the new DC United Soccer stadium which opens in July 2018. This has the potential to a valuable site similar to Dock 79 (close to Nationals baseball stadium).
What are the future possibilities?
1. Spin off of mining segment
2. 1031 exchange for the Industrial warehouse sale
3. Continued development of Riverfront Phases II - IV
4. Massive growth in Buzzard Point area, similar to Capitol Riverfront / Navy Yard area
5. Sale of Hampstead residential lots with horizontal development
Sunday, April 22, 2018
Book Review (and short snippets): The Great Depression - a diary
This book is based on diary written by Benjamin Roth, a mid 30s lawyer in Youngstown, OH and is focused mainly on 1931 to 1941 period. The unique aspect of the book is that he captures the investment environment, opinions of "experts", stock prices, and outcomes of investments from 1930s to 1960s. There are interesting case studies involving several people making investment errors and ignoring risks during the boom of 1920s. One example below shows $180K initial investment reduced to $10K.

While statistics such as "market fell down 90% during Great Depression" are thrown often around on Twitter, reading of Roth's diary makes the impact feel more "real". It moves slowly through the market crash days and shows that it wasn't a linear drop, but many mini-busts and mini-booms and many false starts. Before reading the book, I didn't know of 1937 business slow down and stock market drop.
Youngstown was one of the boom towns of the 1920s with rapid growth in steel industry, followed by steep drop in steel factory utilization and unemployment in the 1930s. This provides Roth with unique insight into the bust phase of a previously booming town. An example below about two brothers shows how people got caught into the boom of 1920s and recycled money into speculative priced assets is shown below (with disastrous results). Margin (leverage) made the results worse!


In addition to stocks, real estate investments got big losses in the Great Depressions. Examples below on houses, vacant residential lots and commercial real estate also show decades of underperformance following the crash. For houses, prices didn't rise above 1929 highs for another 25 years. Also landlords struggled with recouping their carrying costs due to depressed rents. Same for vacant lots - most didn't recoup the carrying costs. Downtown commercial real estate suffered due to flight from cities to suburbs following the WW II, GI bill and building of freeways.


Roth captures well-reasoned forecasts from various economy and market experts, only to show time and again that those forecasts were just wrong. In the end, he concludes that its best to make safe investments where price is lower than intrinsic value. And to keep cash (liquid capital) and courage to take advantage of recessions and bear markets. Roth cites example of Floyd Odlum as someone who had cash and the courage to put it to great use to buy undervalued stocks during the crisis and became one of top 10 richest tycoons in the US. This reminds me of Seth Klarman's comment that "cash is dry gunpowder" and makes me more comfortable holding higher % of assets in cash to take advantages of downturns.
This book provokes lot of thought around the central question on risk in investments: How does one protect capital? And it shows how things can go horribly wrong when risk is ignored. Sometimes, it is hard to remember this in midst of a long running bull market like today. While a crash like Great Depression might not happen again, its still useful to remember that big crashes are a possibility. And risk doesn't disappear just because its not obvious.
Additional suggested reading:
1. Howard Marks: The Most Important Thing
2. John Kenneth Galbraith: A Brief history of Financial Euphoria
Monday, April 2, 2018
How Reddit post got me thinking on speculative pricing of assets
I recently came across this reddit post -- someone with $310K income asking about whether they should try to buy $800K condo with 1 bed, 1 bath in San Francisco. Now $800K is the asking price which probably means that people will bid it up another 10%-20% because that's the "norm".

Two things caught my eye in this post:
1. The carrying costs of this condo (interest, property taxes, HOA fees) will be ~$4K / month, which is higher than renting an equivalent apartment ($3.2K - $3.6K) in the same SOMA area in San Francisco. Clearly its cheaper to rent vs buy, but probably the fear of being priced out in the future is driving this person's actions.
2. This person has close to 14% of their net worth in cryptocurrency!
Could this Reddit posting person be recycling capital from the good ($310K combined salary, presumably from tech) into the speculative ($800K for 1 bed / 1 bath condo, $45K in cyptocurrency)? Probably they're trying to get "fast appreciation of assets" to buy that 1000 sq ft $2.5M Palo Alto home 10 years down the road.
Could this be a speculative episode justified by housing shortage, tech riches (currently), and fear of missing out if not acted immediately?
What are the conditions for a speculative high pricing of assets?
I turned to John Kenneth Galbraith's A Short History of Financial Euphoria for some answers. Galbraith says that speculative episodes are caused by people either thinking this time is different (due to new technology or new opportunity), or they think that they are smart enough to get out before the speculation dies (they won't be the last fool holding the asset).Another theme in Galbraith's book is that progress in finance is cyclical - there is no permanent high plateau. And the gap between the cycles is ~20 years because the memories of the old bubble are lost in that period.
Based on Galbraith's description, these might be potential candidates for speculative pricing :
1. Technology ETFs
I hear these two things a lot here in Silicon Valley -
a. This is a new dawn, tech will do great as investment regardless of valuation (insert some buzzword here like AI, or machine learning, or self driving)
b. ETFs are the way to go, and there's almost universal consensus that human investors underperform the market. Even better if there's an app to invest one's money ("automate, why do the hard work yourself?")
There's lot of conversation around FAANGs that sounds similar to Nifty Fifty from 1970s. Nifty fifty were fast growing companies (McDonald's, IBM, Texas Instruments, Digital Equipment Corp, Coca-Cola, etc) that were considered a buy at any pricing (price being 42 times earning at the peak), before losing 2/3rd of their price in the crash from 1972 to 1975. Here's a good article on Nifty Fifty.
FAANGs areno doubt great companies (i.e. have great products), but are the valuations too rich?
2. Bitcoin / cryptocurrency
It has all the ingredients for a bubble : Shady operators, unregulated markets, product without intrinsic value, your cousin telling you why you ought to buy it.
See the chart below and here's the accompanying writeup on why Bitcoin might be a bubble.

3. Housing cost in big cities
The SF condo post from Reddit highlights how renting is cheaper than buying. But SF is hardly the only city that has speculative pricing for houses. A recent FT article showed how house prices in all major cities in the world rose rapidly and in unison after the 2008 crash. Global low interest rates were cited as the cause, along with flight to safety for foreign (read Chinese) capital into real estate in "global cities". As James Grant says, low interest rates lead to mispricing of capital and credit, and thereby mispricing of risk.
The most interesting case in terms of real estate speculation seems to be Toronto. Toronto Star archives paint a scary picture of the 1990s Toronto housing bubble - some examples being a penthouse sold for $299,000 in 1991 when a couple of years ago it would have reaped $450,000 to $495,000. There was also story of elderly man buying 3 condos with his $300K retirement and losing it. Sounds like people stretched too much to buy house that they could not afford.
And now in 2018, some similar things are repeating in Toronto - buyers are walking away from signed deals, and some are selling houses at steep losses within an year, see the tweet example below (h/t @ExtraGuac4Me). Another example was when @catosletters heard a CIBC bank teller telling him that she bought a second condo and rented it back to previous owner! Even back in 2015, Mr Money Mustache showed how renting in Toronto was way cheaper than buying. Could this be a repeat of 1990s since 20 years have passed and the memories of the previous crash have faded?

Two things caught my eye in this post:
1. The carrying costs of this condo (interest, property taxes, HOA fees) will be ~$4K / month, which is higher than renting an equivalent apartment ($3.2K - $3.6K) in the same SOMA area in San Francisco. Clearly its cheaper to rent vs buy, but probably the fear of being priced out in the future is driving this person's actions.
2. This person has close to 14% of their net worth in cryptocurrency!
Could this Reddit posting person be recycling capital from the good ($310K combined salary, presumably from tech) into the speculative ($800K for 1 bed / 1 bath condo, $45K in cyptocurrency)? Probably they're trying to get "fast appreciation of assets" to buy that 1000 sq ft $2.5M Palo Alto home 10 years down the road.
Could this be a speculative episode justified by housing shortage, tech riches (currently), and fear of missing out if not acted immediately?
What are the conditions for a speculative high pricing of assets?
I turned to John Kenneth Galbraith's A Short History of Financial Euphoria for some answers. Galbraith says that speculative episodes are caused by people either thinking this time is different (due to new technology or new opportunity), or they think that they are smart enough to get out before the speculation dies (they won't be the last fool holding the asset).Another theme in Galbraith's book is that progress in finance is cyclical - there is no permanent high plateau. And the gap between the cycles is ~20 years because the memories of the old bubble are lost in that period.
1. Technology ETFs
I hear these two things a lot here in Silicon Valley -
a. This is a new dawn, tech will do great as investment regardless of valuation (insert some buzzword here like AI, or machine learning, or self driving)
b. ETFs are the way to go, and there's almost universal consensus that human investors underperform the market. Even better if there's an app to invest one's money ("automate, why do the hard work yourself?")
There's lot of conversation around FAANGs that sounds similar to Nifty Fifty from 1970s. Nifty fifty were fast growing companies (McDonald's, IBM, Texas Instruments, Digital Equipment Corp, Coca-Cola, etc) that were considered a buy at any pricing (price being 42 times earning at the peak), before losing 2/3rd of their price in the crash from 1972 to 1975. Here's a good article on Nifty Fifty.
FAANGs are
2. Bitcoin / cryptocurrency
It has all the ingredients for a bubble : Shady operators, unregulated markets, product without intrinsic value, your cousin telling you why you ought to buy it.
See the chart below and here's the accompanying writeup on why Bitcoin might be a bubble.
3. Housing cost in big cities
The SF condo post from Reddit highlights how renting is cheaper than buying. But SF is hardly the only city that has speculative pricing for houses. A recent FT article showed how house prices in all major cities in the world rose rapidly and in unison after the 2008 crash. Global low interest rates were cited as the cause, along with flight to safety for foreign (read Chinese) capital into real estate in "global cities". As James Grant says, low interest rates lead to mispricing of capital and credit, and thereby mispricing of risk.
The most interesting case in terms of real estate speculation seems to be Toronto. Toronto Star archives paint a scary picture of the 1990s Toronto housing bubble - some examples being a penthouse sold for $299,000 in 1991 when a couple of years ago it would have reaped $450,000 to $495,000. There was also story of elderly man buying 3 condos with his $300K retirement and losing it. Sounds like people stretched too much to buy house that they could not afford.
And now in 2018, some similar things are repeating in Toronto - buyers are walking away from signed deals, and some are selling houses at steep losses within an year, see the tweet example below (h/t @ExtraGuac4Me). Another example was when @catosletters heard a CIBC bank teller telling him that she bought a second condo and rented it back to previous owner! Even back in 2015, Mr Money Mustache showed how renting in Toronto was way cheaper than buying. Could this be a repeat of 1990s since 20 years have passed and the memories of the previous crash have faded?
Richmond Hill bungalow bought for $1.5M in April 2017. House sold again for $1.12M this month for a loss of $380k + $45k (realty fees) + $26k (LTT)= $451k total minimum loss. I wonder if the original buyer was a student at last year’s Real Estate Wealth Expo in Toronto. #tore pic.twitter.com/1sKCOJ1RqV— Joey (@ExtraGuac4Me) February 28, 2018
Chatting with my teller at CIBC who told me she sold all her stock to which I commended her. Chatting more I discovered she put the money in a condo (her 2nd prop) as an investment. She told me the seller is still living there and paying rent to her. She said "Isn't that weird?"— Chris Joel (@catosletters) March 29, 2018
Friday, March 9, 2018
Drive Shack - Asymmetric risk reward situation with this TopGolf competitor
Drive Shack, formerly Newcastle Investment (NCT), is a golf management company. The original thesis for Drive Shack (DS) and valuation is here . When I first bought it ~$3/share, the thesis was that there were forced sellers due to cancellation of dividend and REIT status. Add to it the headline risk of "Golf is declining". I was happy to buy from these forced sellers.
Since then, the stock price has gone up ~70% after Wes Edens increased his ownership to 9%, buying $2.5M of stock at $6 / share. While Wes Eden's buy is a good sign, there are several other developments which require a revision to the original thesis. As announced in Q417 earnings call, the company is transitioning away from being owner of traditional golf courses to development of Topgolf like golf entertainment sites. So I want to look at it as a development company and an example of balance sheet to income statement investment.
Some key recent developments are:

Let's examine the management plan to sell owned courses:
DS claims that they can sell their owned golf courses for 8x - 10X EBITDA plus added premium for CA. They estimate that they can sell their owned golf courses for $200M - $325M, minus $100M debt, leading to Net proceeds $100M to $225M.
DS claims that they can sell their owned golf courses for 8x - 10X EBITDA plus added premium for CA. They estimate that they can sell their owned golf courses for $200M - $325M, minus $100M debt, leading to Net proceeds $100M to $225M.

Let's try to assess these golf course valuation estimates with other recent transactions:
a. Chinese buyers
In 2016, HNA Holdings (Chinese conglomerate) bought 10 golf courses in 5 Puget Sound counties for $137.5 million (1880 acres) from Oki golf as part of sale and leaseback transaction.
b. Private Equity buyers
Apollo bought Club Corp at 7.5x 2018 EBITDA in 2017 ( https://bloom.bg/2t4Ksxx )
c. Residential developers
The Carmel Highland Golf Course in Rancho Penasquitos, which closed in 2015, was sold a year later for $14.5 million to a developer who plans to build housing on the 114-acre site. This implies valuation of $120K / acre.
One caveat here is that redeveloping golf courses for housing in CA is hard due to NIMBY opposition. For example, Escondido golf course was zoned for residential development but still took ~5 years to start development, while Poway golf course was zoned for open space/recreation and residents voted against changing part of the course zoning to residential for condo development.
If we take the $72K / acre valuation from the Oki golf sale and add 20% California premium for the 14 DS CA golf courses with ~2000 acres, we get valuation of $172M. Let's assume that the non CA courses produce $10M EBITDA and assume 8x EBITDA multiple (similar to Club Corp deal), we get valuation of $80M for non CA courses. So total valuation of $252M for all owned golf courses, close to the mid point of what the company gave as valuation range ($200M - $325M). This validates the company estimate of $300M cash that they can then pour into constructing Drive Shack locations.
Here's what the company thinks the Drive Shack locations should be valued at (h/t @KonekoResearch twitter post for table below):
Here's what the company thinks the Drive Shack locations should be valued at (h/t @KonekoResearch twitter post for table below):

To validate management projections for Drive Shack concept, it will be useful to look at projection from rival Topgolf. From https://bloom.bg/2oWnTvM, Topgolf says it takes $20M - $25M to construct each site, revenues are 15-20mm/facility and the EBITDA margin is 40% (this EBITDA margin number is on various websites but could not find a source attributable to Topgolf executives quotes). These numbers provide good support for management numbers on cost and EBITDA per site. Drive Shack has the second follower advantage here and they can just copy what works at Topgolf, thereby reducing risk.
I doubt that the market will value it at 20X EBITDA (nice try, Drive Shack CEO!). 10X -15X EBITDA seems more reasonable given the growth rate, and leads to range of values from $11 /share to $16 / share which is lot higher than current share price in $5 range. Getting to 15 Drive shack locations can take between 1.5 to 3 years, so a 3 year time horizon seems the right way to view this investment.
Its important to note that there is additional value above $11 - $16 / share from these factors:
1. Managed / leased golf courses could be worth $100M - $200M (4X - 8X EBITDA multiple) which is additional $1.6 - $3.3 / share
2. The company will have unlevered balance sheet in the valuation case discussed here. There will be additional ways to unlock value such as taking on some debt, buying back stock, instituting a dividend etc. Hard to put a number on it though.
Risks:
1. Its possible Drive Shack concept fails, and cannot copy what Topgolf has done. Topgolf has proven the concept, so its really a matter of choosing the right site and then copying what works at Topgolf. Let's say that Drive Shack still fails in copying Topgolf due to unproven / unskilled management, and the first 5 sites are closed. I think there's still enough downside protection even in this case. If first 5 sites are shut down, Drive Shack will have cash of ~$200M (this is from wind down of legacy assets + Sale of golf courses - $100M cost of building 5 Drive Shack sites). The managed golf courses are worth $100M - $200M. So total valuation of $300M - $400M ($ 4.5 - $6 / share). This means that there's downside protection at current share price of ~$5/ share.
2. The sale price of CA owned golf courses is lower than estimated here. This is possible but low likelihood because DS has the time to sell the owned golf courses either piecemeal or as a packaged deal, and they can wait to get the best price from the potential buyers (Chinese buyers, PE, or real estate developers).
3. Recovery from legacy RE assets is less than $75M estimated by management.
Subscribe to:
Posts (Atom)
Scheid Vineyards (SVIN) - substantial upside potential
I first found about Scheid in a writeup from Aaron Edelheit. Scheid is the 33rd largest winery in the United States when measured by num...
-
 I previously wrote about Marty Whitman's insights on Value Investing . One key insight is to focus on what the numbers mean and not ju...
 -
 I first found about Scheid in a writeup from Aaron Edelheit. Scheid is the 33rd largest winery in the United States when measured by num...
 -
 Lately, I’ve been thinking about middlemen businesses. The Private Investment Brief wrote this thought provoking article on middlemen a...